Page History
...
Milestones (in the process diagram depicted by a diamond  ) are used as goal for each phase. A milestone is merely a decision and is based on data and artifacts. The milestone for the phase Apply for instance is only true (and therefor reached) when the application is complete, meaning all mandatory data is provided and necessary documents are uploaded. Milestones are used to steer the phases at a high level. In theory each phase has one milestone that ends the phase and each phase (except the first one) will only be opened when the milestone of the previous phase is reached. It is very uncommon and not advisable to design a process that can be in two phases at once or no phase at all.
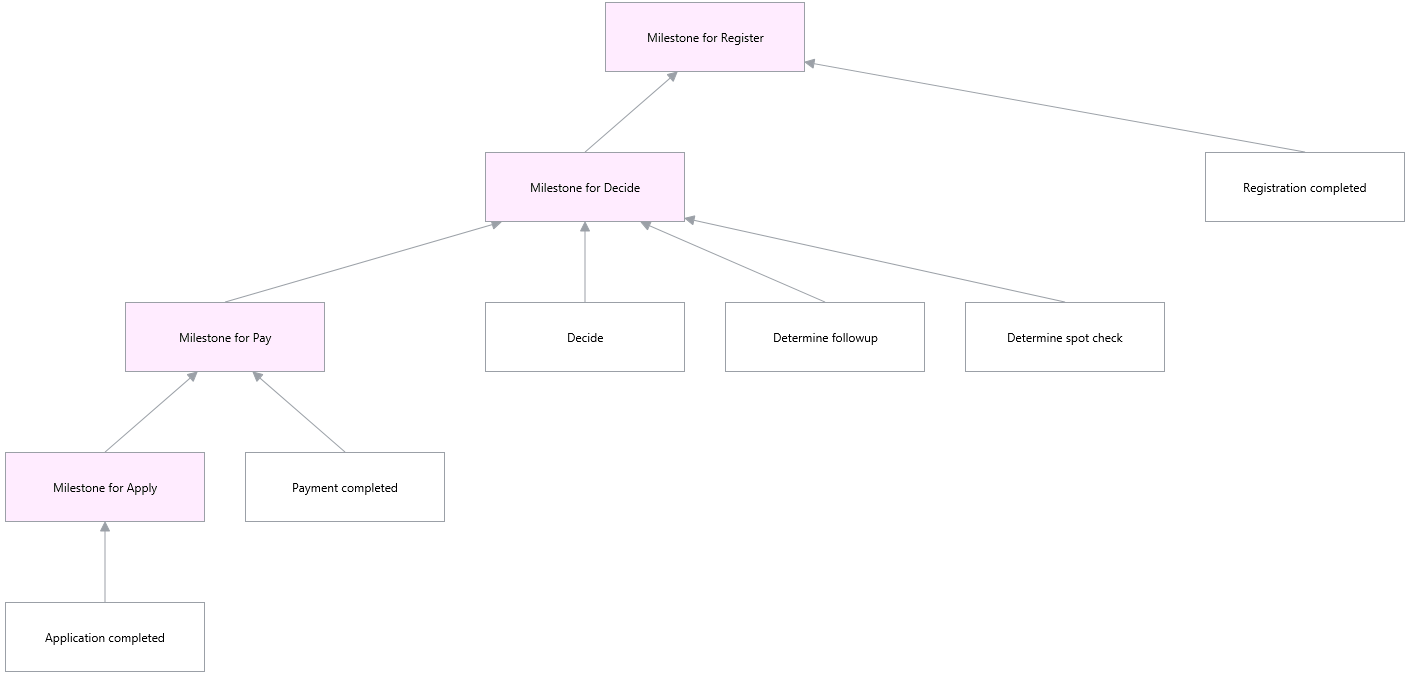
Milestones are merely decisions. As mentioned in a previous article (How to use Decision Requirements Graphs to visualize ad-hoc tasks in business process modeling), a decision requirements graph can be used to visualize the entire process. See below and compare this diagram with the first diagram of this article.
Benefits of the design
The main question one might ask is why the design described here should be used. What are the benefits?
...
Of course there are some concerns regarding this approach. The main concern regards insight. In As mentioned before, in a previous article (How to use Decision Requirements Graphs to visualize ad-hoc tasks in business process modeling), we discussed how Decision Requirements Graphs help visualize ad-hoc tasks. This article was written as a response to often heard comments on ad-hoc task modeling regarding insight and overview when modeling business processes with ad-hoc tasks rather than (work)flow oriented tasks. Using the strategy described in this article, combined with the design as outlined here, will result in dynamic processes which are not only really flexible, but also maintainable.
...
Overview
Content Tools